Definitions
Weather: the short term atmospheric conditions
Climate: the longer term average atmospheric conditions


Definitions
Weather: the short term atmospheric conditions
Climate: the longer term average atmospheric conditions
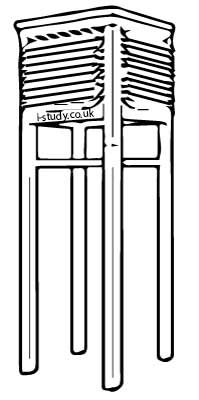
Stevenson Screen
These are used to standardise the way that weather temperatures are recorded around the world.
They are a white wooden box structure that is raised 120cm off the ground to reduce the effect of heat radiated from the ground surface.
The white colour reflects sunlight and they have slatted sides to allow air to flow through.
Thermometers and hygrometers are kept in Stevenson screens, barometers may also be placed in there to shelter from the rain.
Instruments for Measuring the Weather
You need to be able to describe how the different types of weather are measured and give the units of measurement.
Tasks
For each of the weather types below,
| Weather | Instrument | Measurement |
| Precipitation | Rain guage | Milimeters |
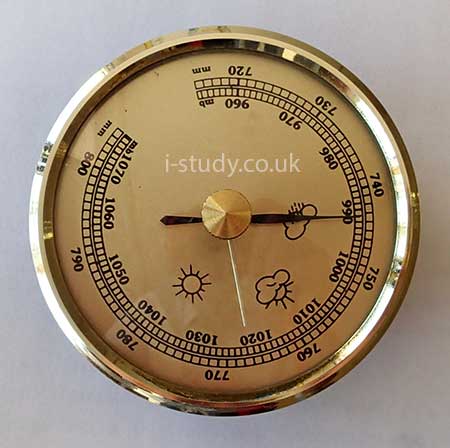
| Air pressure | Barometer | Milibars |
| Wind speed | Anemometer | km/hour |
| Wind direction | Weather vane | Compass directions |
| Temperature | Thermometer (max-min) | Degrees centigrade |
| Humididity | Hygrometer | Percentage |
| Cloud cover | Eyes | Oktas |
Many weather recording instruments are now digital - with the data being logged straight into spreadsheets.
Cloud Types
There are several distinct cloud types that you should be able to recognise and describe their characteristics.
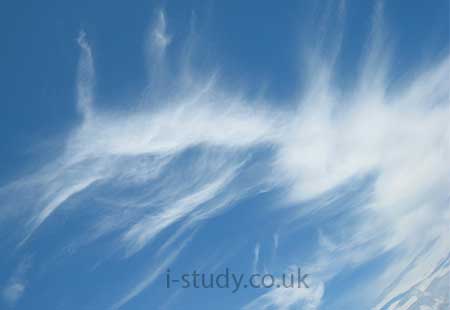
Cirrus: high clouds that are thin and wispy, composed of ice crystals (Fig 2.44).
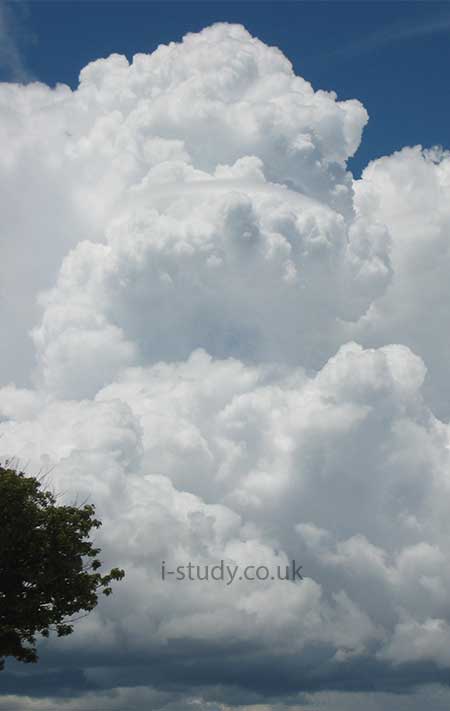
Cumulonimbus: towering storm clouds with dark bases and usually an anvil shaped top (Fig 2.48).
Cumulus: dense, mound shaped clouds with a darker bottom (Fig 2.45).
Stratocumulus: common low lying cloud that appears layered. Like flattened cumulus clouds (Fig 2.46).
Stratus: low, hazy, featureless clouds that often bring light rain/drizzle (Fig 2.47).
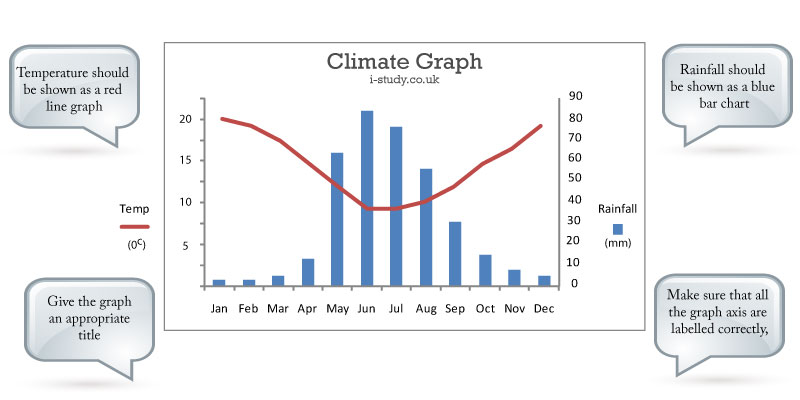
Climate Graphs
You should be able to accurately draw climate graphs - remember to label the axis and give it an appropriate title.
You are expected to be able to read and interpret the data shown in climate graphs and suggest reasons for the trends shown.
Revision Guides