


Globalisation
Tasks
Vast quantities of electrical waste from developed countries end up being shipped to less developed countries for recycling. Basic techniques and poor regulation of the industry is resulting in significant environmental damage and causing health problems for the workers involved.
Tasks
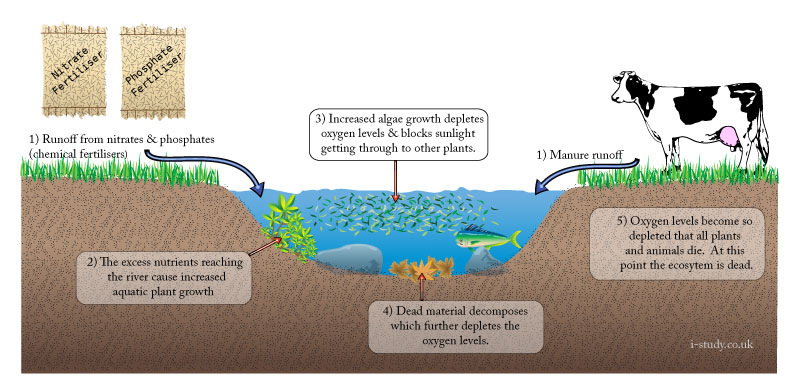
Eutrophication occurs when fertilisers (leaching) or animal waste (runoff) enters water courses (rivers and lakes) and causes excess growth of algae and aquatic plants. This extra growth depletes the oygen in the water ultimately leading to the death of fish and other marine species. The additional plant growth blocks out sunlight.
The environmental impact is the decline of the species diversity in the river/lake ecosystem.
Tasks
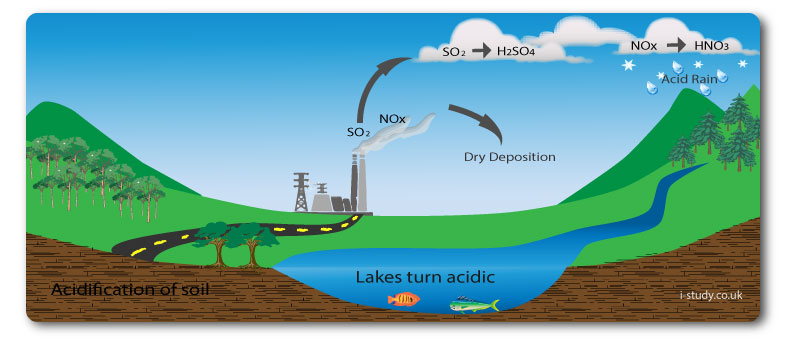
Industry and transport release nitrogen oxides and sulphur dioxides through the burning of fossil fuels. These gases mix with moisture in the atmosphere and fall as acid rain (nitric and sulphuric acid).
Acid rain can be a truly international pollution even due to the pollution emmitted by one country falling as acid rain in another one.
Acid rain affects trees (burning conifer needles and damaging the roots ability to absorb nutrients). It also turns lakes increasibgly acidic leading to a decrease in the biodiversity.
Tasks
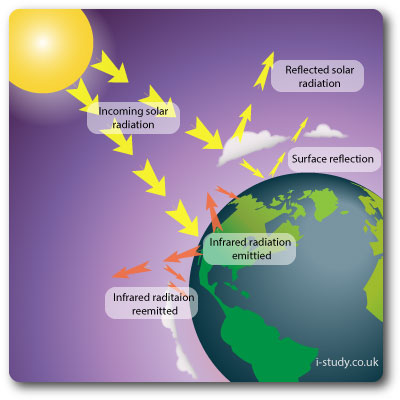
Climate change has dominated environmental headlines over recent years with much of the dicsussion revolving around the greenhouse effect.
Incoming solar radiation brings energy into the atmosphere, some is reflected by clouds/atmospheric pollution, some is reflected by the earths surface (albedo rates), the rest is absorbed by the oceans and land.
The absorbed sunlight is transformed into heat energy and released back into the atmosphere as longerwave radiation (infra-red). It is this type of radiation that is being increasingly trapped in the atmosphere leading to warming.
Climate change is a major concern due to its environmental implications and subsequent economic impacts. In addition it is a global problem that will require coordinated efforts to start reaching effective solutions.
Tasks
Revision Guides