The world is experiencing a population explosion driven primarily by relatively high birth rates in LEDCs coupled with falling death rates. The fastest growing populations are all in developing countries, while some MEDCs are facing population decline.
As demands for shared resources such as water increase international relations are become increasingly tested.
Causes of Population Change
Population growth occurs because of two factors:
Natural Increase: when the birth rate is higher than the death rate.
Net Migration Gain: when the number of migrants into a country exceeds the number leaving a country.
The reverse of these would result in population decline (natural decrease and net migration loss).
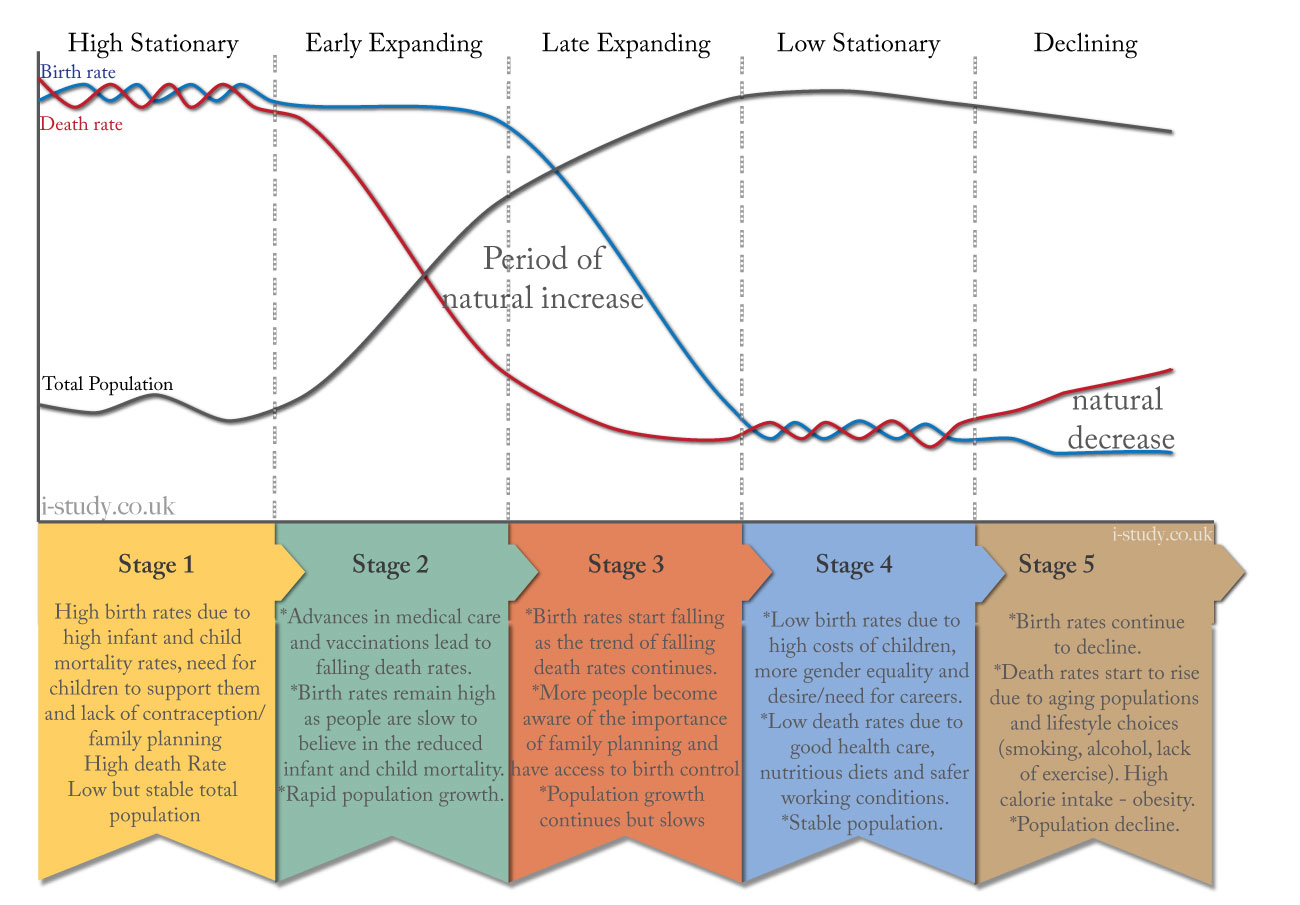
Study Figure 2.2 which shows the typical population growth pattern that most countries follow (at different rates).
Figure 1.?: Demographic Transition Model
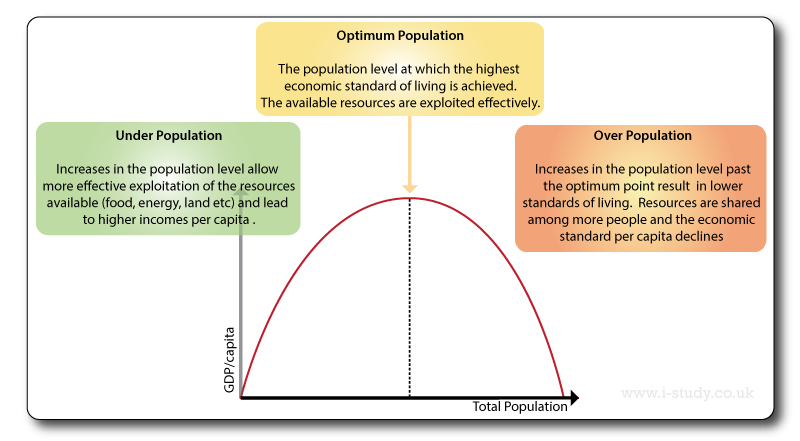
Overpopulation and Underpopulation
Underpopulation - Australia
Open this case study sheet from geocoops. Either print it/save it or make notes in your book.
What factors mentioned suggest that Indonesia has become over-populated.
What problems are likely due to overpopulation? Seperate your answer into human and environmental.
Figure 1. : Optimum Population Curve
Population policies
Anti-natalist
These policies are intended to reduce the birth rate. They can be enforced through laws and government policy such as in China, or they can focus on encouraging people to change their habits through education and public campaigns. They are most common in developing countries where the fertility rate is high.
Tasks
Describe the methods used/approaches taken to reduce the birth rate.
How sucessfull has this anti-natalist policy been?
Video 1.1: Thailand Anti-natatist Approach
Pro-natalist
These are policies aimed at encouraging people to have more children and raise the fertility rate. They are most common in developed countries that are experiencing aging populations.
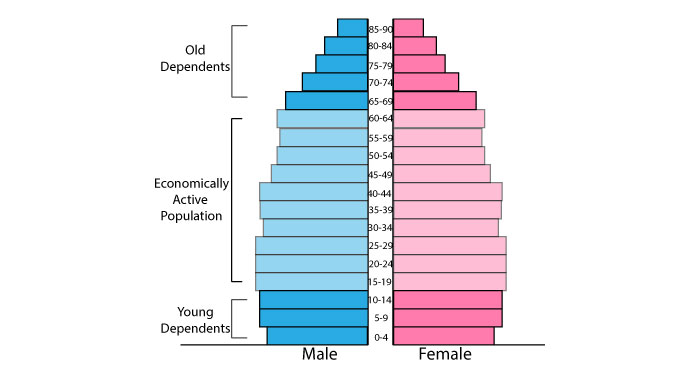
MEDC pyramids tend to be narrow at the base (low birth rate) and remain a similar shape up to the ages of 65+ due to a low death rate through these ages.
The pyramid is often tall due to long life expectancy.
Tasks
Describe the challenges that countries with population pyramids such as fig 2.6.
Suggest ways in which these countries could attempt to solve some of the problems that they face.
Watch video 2.2 and make notes about the issue in Japan.
Figure Developed Country StructureVideo 2.2: Japans Aging Population
Pro-natalist Policies
These are policies aimed at encouraging people to have more children and raise the fertility rate. They are most common in developed countries that are experiencing aging populations.
What is the replacement level needed to maintain a steady population level?
What policy has Russia used to boost the fertility rate?
Use this prezi to make notes about the Russian policy
Video: Russian Pro-natatist Approach
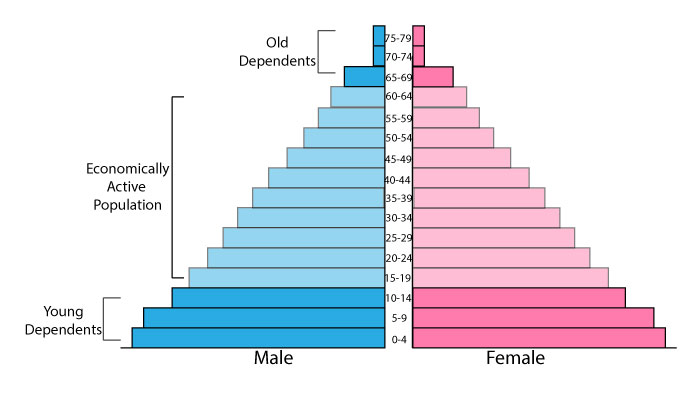
Developing Countries Structures
LEDC pyramids typically have wide bases due to high birth rates.
A classic pyramid shape with sloping sides due to a high death rate at all ages.
They are short due to relatively low life expectancy.
Tasks
Describe the potential benefits of a population structure with this shape?
Which global regions/continents have the majority of the woulds young people?
Describe the challenges for countries with pyramids that have a wide base.
Figure ?? Developing Country StructureVideo 2.3: Youthful Populations
Anti-natalist Policies
These policies are intended to reduce the birth rate. They can be enforced through laws and government policy such as in China, or they can focus on encouraging people to change their habits through education and public campaigns. They are most common in developing countries where the fertility rate is high.
Tasks
Describe the methods used/approaches taken to reduce the birth rate.
How sucessfull has this anti-natalist policy been?
Population distribution is how people are spread out and this can be considered on any scale. People are distributed around the globe but the population density
varies considerably.
Population density refers to how many people live in a given area (usually square km or mile). Areas with fertile soil, good climate and reliable water supplies tend to be densely populated. Areas that have extremes of temperature, steep land, unreliable water supplies and poor soils tend to be sparsely populated.
Population densities are higher in urban areas and the dominat trend of population movement over the last centruy has been towards urban areas.
Describe the global distribution shown in Figure 2.8