


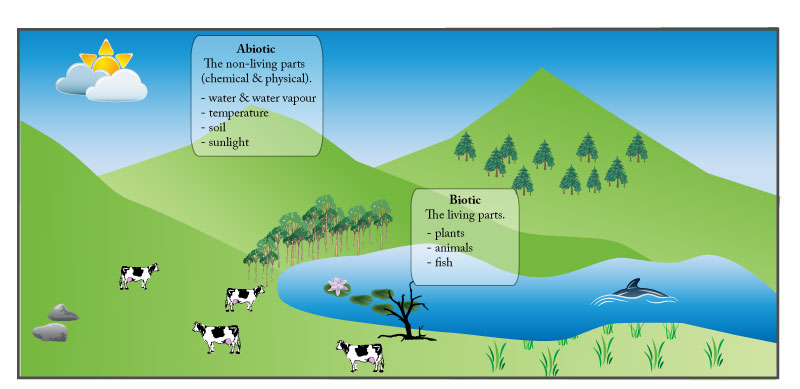
Abiotic factor: A non-living, physical factor that may influence an organism or ecosystem;
for example, temperature, sunlight, pH, salinity, precipitation.
Biotic factor: A living, biological factor that may influence an organism or ecosystem; for example, predation, parasitism, disease, competition.
Trophic Level: The position that an organism occupies in a food chain, or a group of organisms in a community that occupy the same position in food chains.
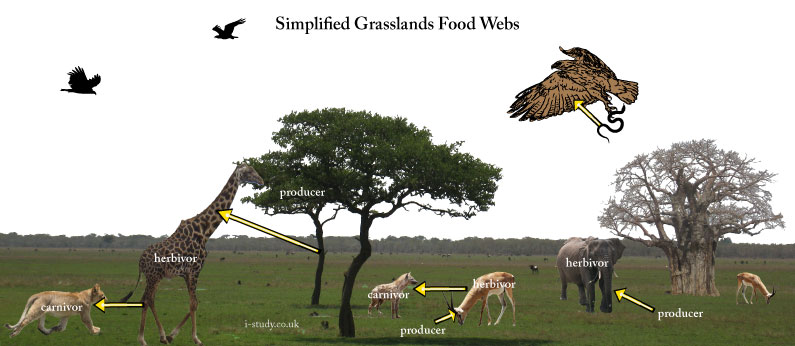
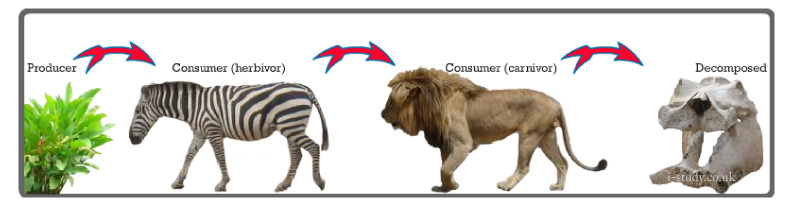
Producers, Cosumers & Decomposers
Plants use the process of photosynthesis to capture sunlight and use it to convert water and carbon dioxide into glucose. This provides the initial energy for growth and the base from which to create the other chemiclas that plants need. Because of this unique ability to produce glucose and use it for growth plants are known as producers.
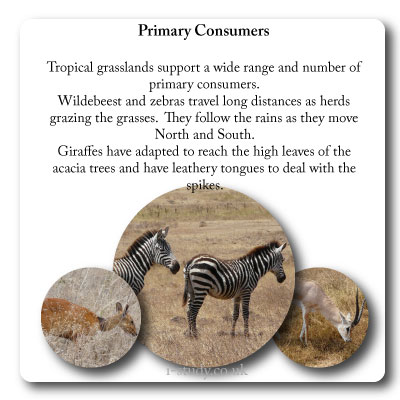
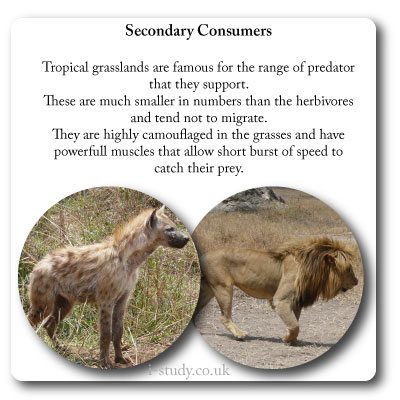
Animals are unable to produce their own energy source so they rely on eating the plants to utilise the energy they produced. This passes the energy created by the plant onto the animal but only a small amount of it. The animals are known as consumers. In this category there may the herbivors that gain the energy from the plants & then the carnivors that eat other animals to gin their energy.
Because a large proportion of the energy is not passed on through food chains, the number of animals at each level that can be supported by the previous level decreases dramatically. This illustrated by the construction of pyrmaids that show the changes at each level in terms of numbers, biomass or productivity.
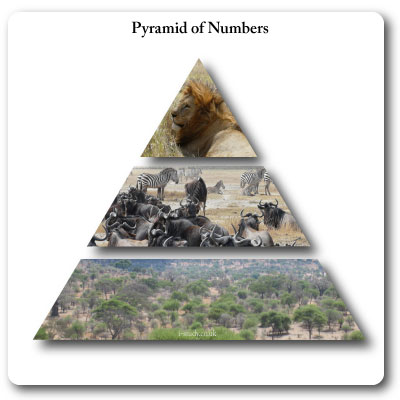
Pyramids of Numbers
Pyramids of numbers show how many plants/animals exist at each trophic level.
They tend to be a classic pyramid shape due to the high number of producers neede to support consumers in their habitats.
As explained above, they narrow as you move upwards as less and less predators can survive on the reduced energy passed along the trophic levels.
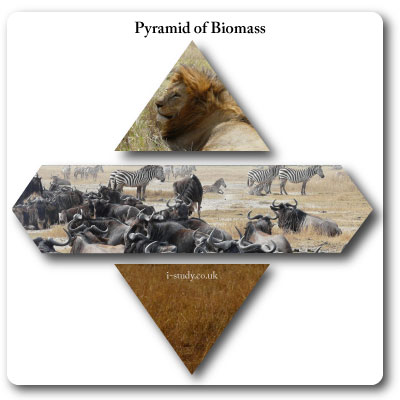
Pyramids of Biomass
These are a snapshot which show the momentary stock of biomass present at each trophic level. Biomass is measured using mass (gm-2) or energy (Jm--2).
Due to this they may resemble the pyramid of numbers, but at certain times of year when high plant growth is low and heavy animal grazing has stripped most of the vegetation they may become inverted.
Pyramids of biomass may change in shape for a certain habitat throughout the year.
The mass of the animals in the diagram is much greater than the remaining grasses that the large herds have been feeding from.
Pyramids of Productivity
Rather than measuring the biomass or energy existing at each trophic level at a certain period of time these are based on the calculation of the flow of energy or mass through the trophic level.
They are based on calculations of mass (gm-2yr-1) or energy (Jm-2yr-1).
Due to measuring the flow through trophic levels they cannot be inverted. They also provide a better method of comparing ecosystems.
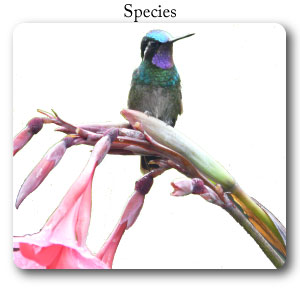
Species: A group of organisms that interbreed and produce fertile offspring.
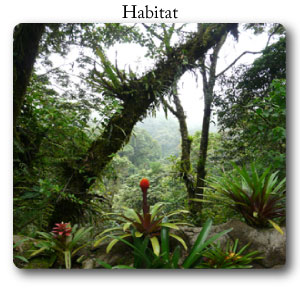
Habitat: The environment in which a species normally lives.
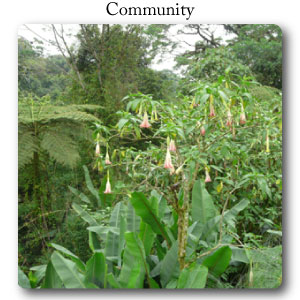
Community:A group of populations living and interacting with each other in a common habitat.
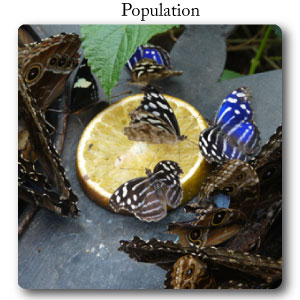
Population: A group of organisms of the same species living in the same area at the same time, and which are capable of interbreeding
Niche:A species’ share of a habitat and the resources in it. An organism’s ecological niche depends not only on where it lives but also on what it does.
Ecosystem:A community of interdependent organisms and the physical environment they inhabit.
The abiotic components of ecosystems are the non-living things such as: soil salinity, soil moisture, soil PH, sunlight levels, water salinity, water PH and temperature.
The abiotic characteristics of an ecosystem will largely determine the type of vegetation and animal life that exists within it.
Measuring the Abiotic Compnenets of Ecosystems |
||||||
Terrestrial Ecosystems |
Temperature: electronic thermometer |
Light Intensity light meter |
Wind Speed: digital anemometer |
Slope/Aspect: Clinometer |
Soil Moisture: Weigh samples before and after oven drying |
Mineral Content |
| River Ecosystems | Flow Velocity
|
Turbidity
|
PH
|
Temperature
|
||
| Marine Ecosystems | Salinity |
Wave Action |
Temperature |
PH |
||
Diversity: A generic term for heterogeneity.
Diversity is a measure of both the number of different species and the abundance of each species. The scientific meaning of diversity becomes clear from the context in which it is used; it may refer to heterogeneity of species or habitat, or to genetic heterogeneity.
Dichotomous Keys
Theses are used to identify organisms (plants, animals, fungi etc).
They work based on a series of identifying questions that have two possible answers. By working through a series of these questions you will eventually come to the correct identification of the organism.
Dichotomous keys can be established specifically for the ecosystem that you are studying.
Click here to be taken to an example of a dichotomous key for tree identification.
Simpsons Diversity Index
D is a measure of species richness. A high value
of D suggests a stable and ancient site, and a
low value of D could suggest pollution, recent
colonization or agricultural management. The
index is normally used in studies of vegetation
but can also be applied to comparisons of animal
(or even all species) diversity.
- For "N" add together the total number of organism in all the species listed. Then multiply this figure by N-1, in this case 19.
- For "n" you need to look only at the number of each organism in a single species. For each species multiply this by n-1. Then calculate the total of n(n-1) for all the species.
- The final calculation to establish "D" in the example would be 380/90.
- The higher the number the higher the species diversity in that ecosystem.
Biome: A collection of ecosystems sharing similar climatic conditions; for example, tundra, tropical rainforest, desert.
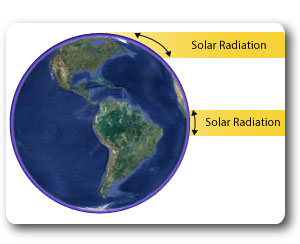
Solar Radiation Received
The concentration of the suns energy reaching the earth diminishes with distance from the equator. As the diagram shows, the curvature of the earth results in the solar radiation being spread over a much wider surface area.
The result of this is much warmer temperatures around the equator which results in high levels of evaporation from the oceans.
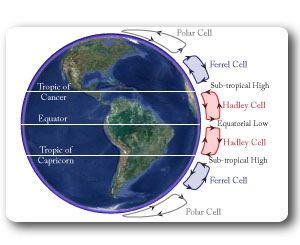
Atmospheric Circulation
- Equatorial low: low pressure surrounding the equator. Rising warm moist air leads to high levels of precipitation, tropical rainforest.
- Sub-tropical high: high pressure areas around the tropics of Cancer & Capricorn. Descending warm dry air results in arid/desert regions.
- These air cells redsitribute heat around the globe through moving warmer air from the equator north & south, and colder air from the poles towards the equator.
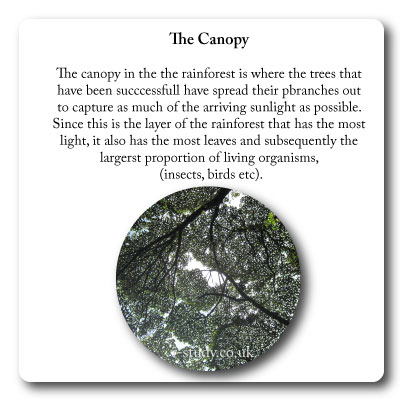
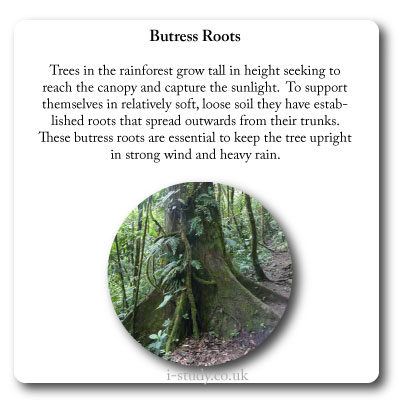
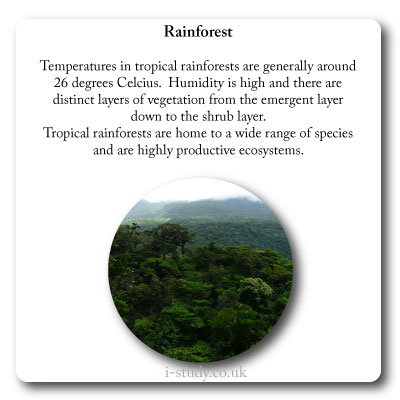
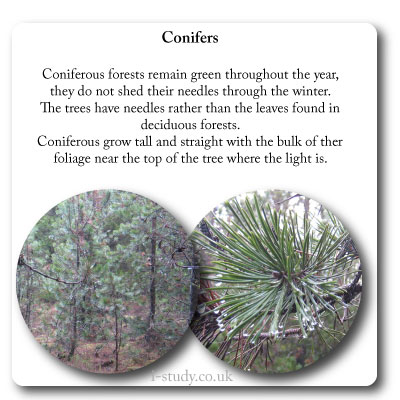
Tropical Rainforest
The low pressure zone created by the rising air around the equator results in high levels of precipitation. This region also has warm atmospheric temperatures due to its relative proximity to the sun and thinner atmosphere for solar energy to pass through. It is in this global band that we find the tropical rainforests of the world.
Deserts
Deserts generally exist in the high pressure zones between the Hadley and Ferrel cells.
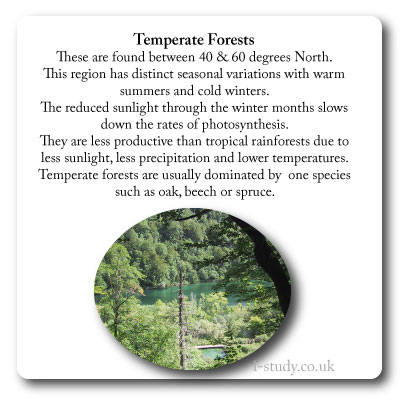
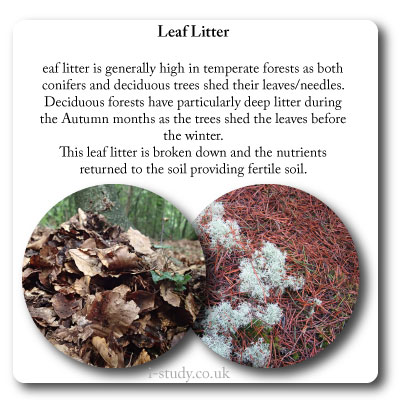
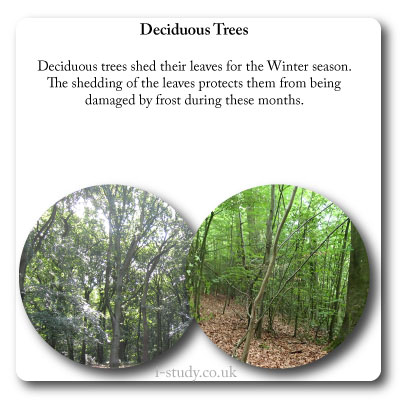
Temperate Forest
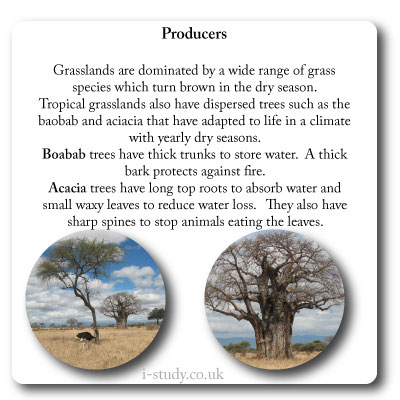
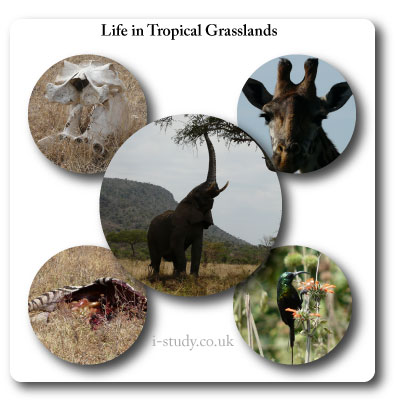
Grasslands
Grasslands exist in a wide range of latitudes and their characteristics differ depending on their location.
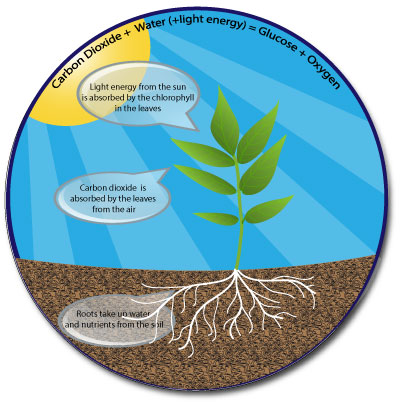
Photosynthesis
This is the process that plants use to produce their own food.
Chloroplasts in the leaves capture sunlight and use it to break down water molecules. They combine this with carbon dioxide to produce glucose which provides their food source. A bi-product of this process is oxgen which is released by the leaves and plays an important role in balancing our atmosphere and providing oxygen for respiration.
The glucose produced is used by the plant to produce all the other chemicals that the plant needs to grow.
It is this process that provides the usable energy that the rest of the food chain relies on.
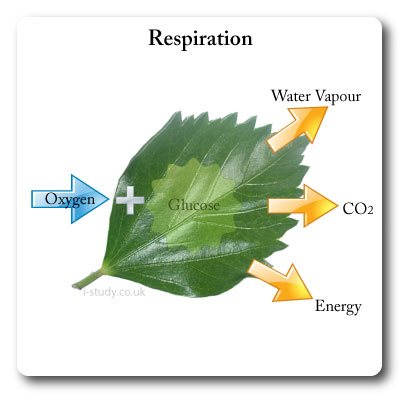
Respiration
This is the process that plants use to release the energy from the food that they have produced.
Respiration is the way that living organisms convert glucose/ food and oxygen into energy.
In doing so it also creates the by-products of water and carbon dioxide.
The energy that respiration creates is used to grow or move and is ultimately lost as heat.
Photosynthesis stops occurng at night when there is insufficient sunlight, respitration continues through the night.
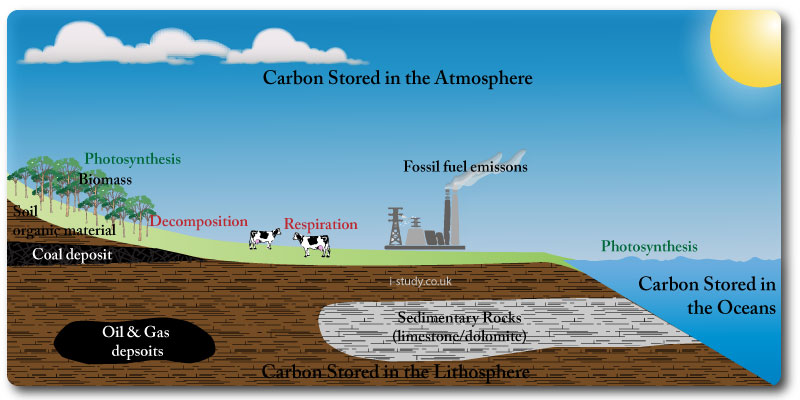
The Carbon Cycle
Carbon is essential to life on earth and is the 4th most abundant chemical on the planet.
The carbon cycle shows the stores and transfers of this element. It exists largely as carbon dioxide in the atmosphere CO2. Moisture in the atmosphere reacts with CO2 to form carbonic acid which is transferred to earth through precipitation. Carbonic acid in rain and rivers dissolves minerals on the earth’s surface (chemical weathering). These dissolved mineral precipitate out as calcite which over time becomes buried and compressed forming limestone.
Seafloor spreading due to tectonic plate movement sub-ducts carbon on the seabed and in sedimentary rocks into the mantle where it melts and is forced back to the surface as CO2 as part of volcanic explosions.
Carbon also cycles though the living parts of ecosystems. During photosynthesis plants used carbon dioxide to create carbohydrates which provide the energy for growth. Carbon is stored in plants and animals. Respiration of plants and animals releases carbon dioxide into the atmosphere. As plants and animals metabolize the stored sugars they release carbon dioxide.
Decomposition or decay of dead plants and animals releases CO2 into the atmosphere. Dead organic matter may also be compressed in the earths crust to form fossil fuels (oil, coal, natural gas). Humans have exploited these underground stores of carbon and released vast quantities of CO2 into the atmosphere through burning them.
Oceans store vast amounts of carbon as it diffuses from the atmosphere into the oceans. Fish and sea creatures use the dissolved carbon dioxide to produce calcium carbonate from the shells and bones.
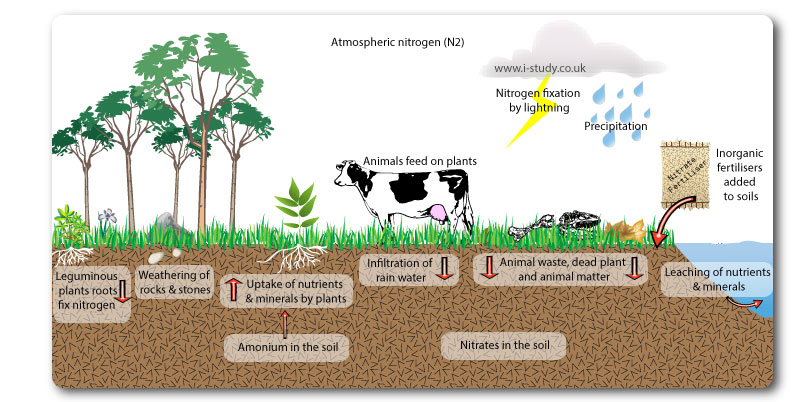
The Nitrogen Cycle
Nitrogen is an essential nutrient that cycles through ecosystems. Living organisms require nitrogen to produce amino acids, proteins and nucleic acids. Most of the nitrogen in ecosystems is found in the atmosphere (N2), but unfortunately plants cannot use atmospheric nitrogen.
Lightning fixation: The extreme temperature of a lightning flash causes nitrogen to combine with oxygen in the air to form nitrogen oxides. Nitrogen oxides combine with moisture in the air. The fixed nitrogen is carried to the earth by rain, infiltrating the soil. It is then used by plants in the form of nitrates.
Leguminous plants have a symbiotic relationship with certain nitrogen fixing bacteria (the plants get the fixed nitrogen from the bacteria, and the bacteria get carbohydrates from the plant).
Plants absorb nitrates from the soil in order to live and grow. Animals then eat plants to obtain the nitrogen that they need for their existence.
Nitrogen is cycled through ecosystems, when organisms die, decomposers convert the nitrogen into ammonium, plants can then use this from the soil.
Humans have drastically altered the nitrogen cycle:
The discovery of how to artificially fix nitrogen through high temperatures and pressure led to the development of synthetic nitrogen fertilizers. These fertilizers significantly increase agricultural productivity but also have some negative effects. Leaching of nitrates into water systems has caused eutrophication.
Nitrous oxides (N2O) released into the air from factories and power stations have led to much higher levels of nitric acid in rainfall. N2O is also an important greenhouse gas which contributes to global warming.
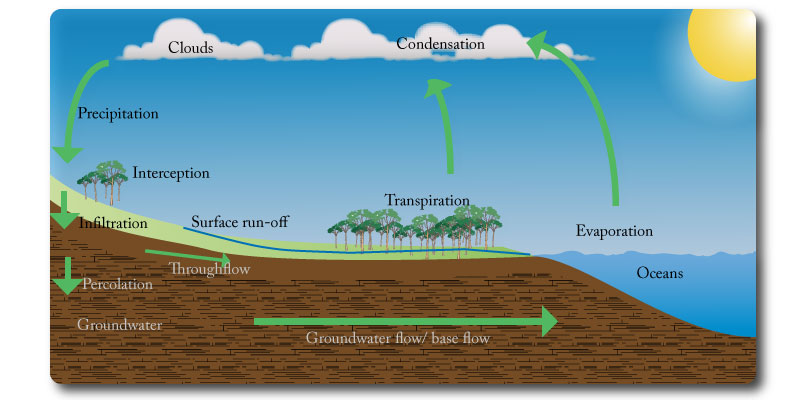
The Water Cycle
The main stores of water are the clouds (water vapour), the oceans, groundwater/aquifers and lakes and glaciers. The periods of time that water is stored in these varies from days (clouds) to thousands of years (aquifers & glaciers).
Water vapour is released by plants and animals through respiration.
Humans modify the water cycle, creating additional stores through dams. Altering transpiration levels through deforestation and evaporation through agricultural practises such as irrigation. Grounwater stores have also been significantly depleted in many regions due to wells for domestic water and irrigation. Climate change affects the proportion of water stored in glaciers and the oceans.
Limiting Factors & Carrying Capacity
Population growth in animals is usually exponential until a limiting factor is encountered. Levels are restricted by various factors and the maximum level of population which an area/ecosystem can support indefinatley is the carrying capacity.
Temperature
The temperature of any climate will be a major limiting factor to the population size of a species. Many species cannot survive in very hot ot very cold climates. Plants ability to photosynthesise are also significantly reduced in cold climates. This has the knock on effect of providing less availabilty of food for any primary consumers thta may be able to withstand the cold.
Water
Areas that are very dry siginficanlty limit the population size of any species. Most species are dependent on a regular and reliable water supply. Some plants and animals have adpated to live in arid conditions but even these have limited productivity and population sizes.
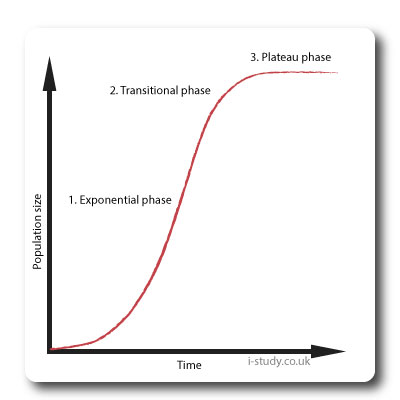
S-Curves
These curves showing the population growth of a species typically have three distinct phases:
- Exponential growth: rapid population expansion due to a lack of limiting factors.
- Transitional phase: rate of population growth slows as increasing competition for available resources (food & water) occurs. Increasing incidents of disease and an increase in predators likely.
- Plateau: population growth is limited by the carying capacity of the ecosystem and so stablises at this level.
The plateau phase represent the birth and death rates of the population being equal.
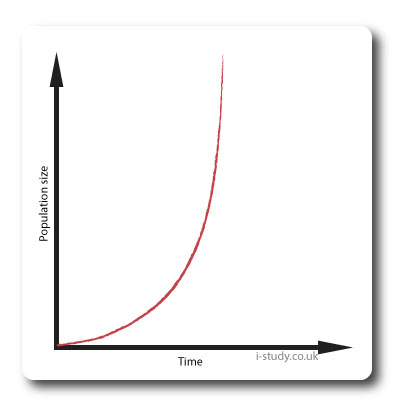
J-Curves
J-curves represent population growth which is not experiencing limiting factors. Most animals will experience limiting factors, however humans are the exception.
- Humans have managed to utilise technology to increase the resources available and use existing resources more efficiently.
- Humans have also managed to use technology to create substitutes for natural resources that are scarce.
- Many people argue that this canot continue indefinatley and that at some point the human race will experience limiting factors and will subsequently plateau.
- The limited nature of many resources on the planet is already prompting companies and scienetists to explore the possibilty of using resources from other planets/the solar system.
Population Density Limiting factors
Density Dependent Factors
Disease, predators, availability of resources limited space are examples of density dependent factors.
As population density increases the availability of resources diminishes leading to competition for them and subsequently a decline in the population if there are not enough (eg food).
Increased population density leads to increased chance of disease and more rapid spread of disease which reduces the population size.
Density depenedent factors operate as negative feedback mechanisms which check the growth of the population size causing it to decline again. These create a steady state equilibrium population level.
Density Independent Factors
These are events/factors that reduce the population size but which are not linked or triggered by population levels.
Natural disasters such as tsunamis, floods, hurricanes, wildfires and volcanoes are examples. These events are likely to kill large numbers of of species in affected areas.
Climate change is a longer term example but is changing ecosystems and habitats at a faster rate than species can adapt to.
R & K Strategists
R- strategists
R strategists are species that are quick to inhabit and establish themselves in unstable environments and are the initial colonisers. They tend to be fast growing, have large numbers of offspring that dont need much parental care. This allows them to quickly establish themselves. They are also small and have short life spans and many of the offspring are likely to die young. Typical examples are insects and spiders, lichens and grasses.
K-stategists
K strategists are species that are the latest species to establish themselves in an environment. They tend to be slow growing and large with few offspring which need significant support from the parents . They have a long life expectancy and most of their young can be expected to live a full life cycle. Typical examples are mammals (whales, elephants, giraffes, buffalo etc).
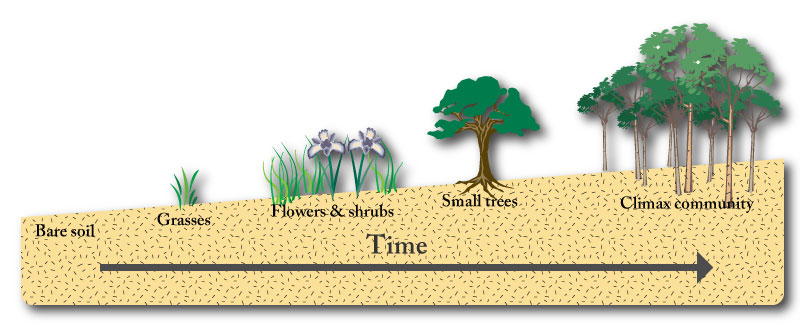
Succession
Succession is the change in the species structure over time in a specified place. Bare soil/substrate is typically initially colonised by mosses/lichens to start with, these are known as the pioneer species. Grasses are likely to follow then shrubs and eventually trees. Eventually the area will be become a stable community that does not change, this is known as the climax community. The stages between are called seral stages.
Primary succession occurs on land that is new - lava flows and major landslips exposing bare rock create these conditions. In primary succession there is initially an absense of soil. The prioneer species and subsequent seral stages start to break down the rock surface and add organic matter.
Secondary succession occurs on land that has been disturbed by events such as fire. In these cases there is pre-existing established soil which is likely to contain seeds and roots of pre-existing plants.
Seral communities have different names depending on the type of environment that they exist in:
- Hydrosere: water environments
- Lithosere: bare rock environments
- Psammosere: sand environments
- Xerosere: dry land environments
- Halosere: salt water environments
London Crossrail & Wetland Regeneration
The london Crossrail project involves digging 21 km of underground tunnel from the East to the West of London. It is being constructed to vastly speed up transport across the capital city. A result of its construction is vast amounts of soil/earth that need to be disposed of. Crossrail are partnering with the RSPB to use 4.5 million tonnes of earth to create wetland areas for marine and bird life. The earth is free from pollution and contamination due to the depths that it is being dug from. It is expected to attract bird species currently lost from the area such as spoonbills. It should provide a nursery environment for various types of saltwater fish. It should also see saltmarsh plants such as sea lavender and samphire establishing themselves.