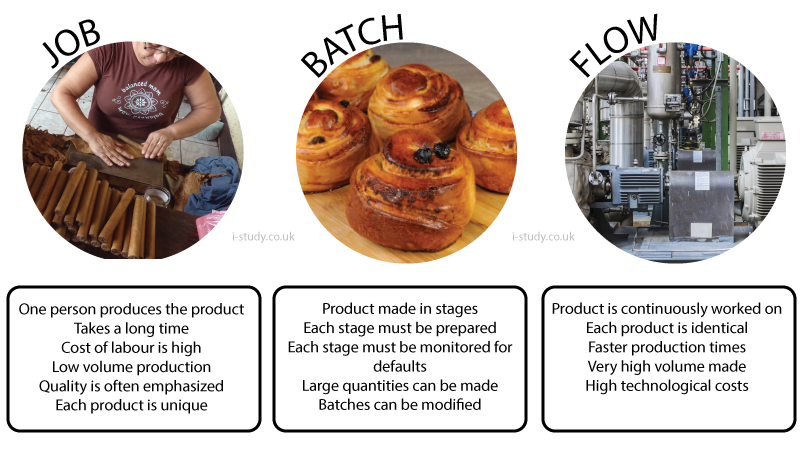
Production and Productivity
Measuring Production
We can measure production by volume (units produced) in total, or as an average. Production is defined as the level of output produced by a company
Measuring Productivity
Productivity is measured as the amount of units produced by one worker or machine. The greater the amount, the greater the productivity. To do this we use the following formula:
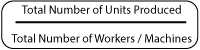
This gives us the Average Productivity of Labour. So, if 100 workers produced 500 goods, then the Average Productivity of Labour would be 5 goods (500/100)
Production and Productivity
CAD: Computer Aided Design Computer software which allows designs to be easily drawn up and edited
CAM: Computer Aided Manufacturing Computer-controlled industrial robots which help create the product e.g. 3D printers
CIM: Computer Integrated Manufacturing The combination of CAD and CIM into one process
Costs
The importance of costs are that they are an essential part of calculating profit. If most firms are profit maximizers then this is crucial. We calculate profit through the equation: Total Revenue - Total Costs
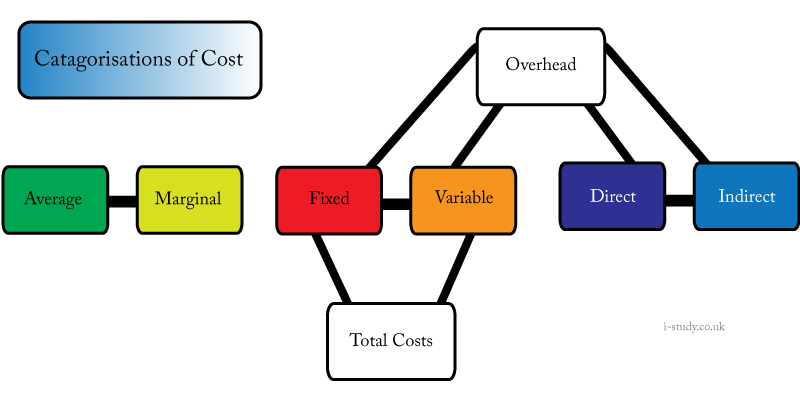
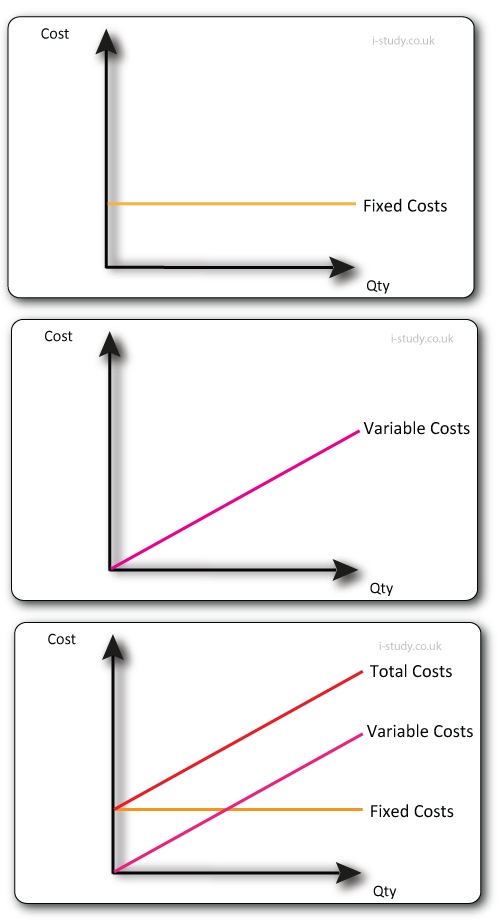
A firm has may different types of costs:
Similarly, a firm has different understandings of revenue. We get
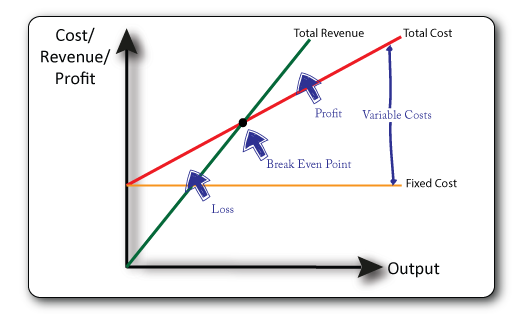
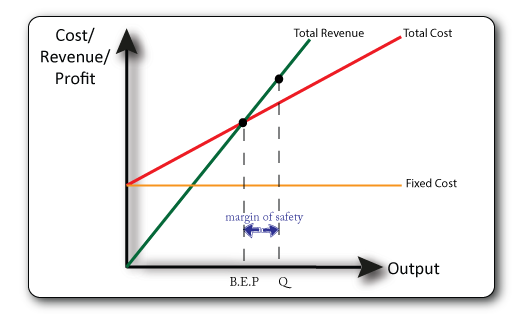
Break Even Analysis
Break Even Analysis puts the some of our cost information onto a graph along with information about revenue to tell us:
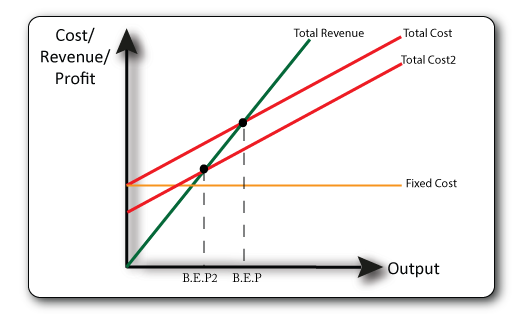
Uses of Break Even Analysis
We use break -even analysis to find out:
Economies of Scale
Economies of scale are when average costs are lowered as a business increases its scale of production. There are different types.
Diseconomies of scale are when average costs rise as a business increases its scale of production. We can identify:
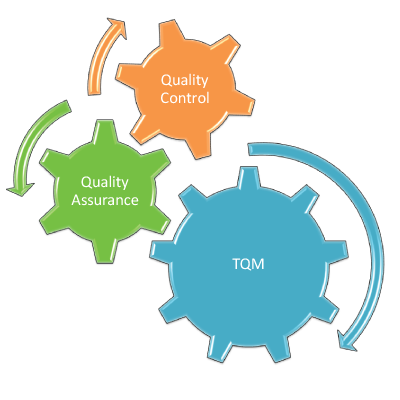
Types of Quality Improvements
Quality Control - when a product is reviewed by the firm after it has been produced. If there is a defect, the product cannot go on sale.
Quality Assurance - when quality is ensured as the product / service is being built. The aim is to produce a product assured of zero defects. This can be done through TQM
Total Quality Management - various techniques that are put in place to ensure quality throughout the production process by creating a zero-defect - or defect-free - product. TQM can take different forms such as;
Location
Factors to consider for locating industry
Factors to consider for locating country