The energy balance
Earths atmopshere receives a constant input of solar radiation (insolation). In recent history there has been a relative balance between the insolation received and the energy re-radiated back out to space - which has kept the atmospheric temperatures stable.
Approximately 30% of the insolation is reflected back out to space - most by the clouds, but about 5% by the earths surface (.
About 45% of insolation is absorbed by the earths surface - which heats the ground and oceans. Some of this heat is tranfered into the atmosphere by convection through gases in the air. Most of the energy is emitted as long-wave radiation, some of which passes out into space, but some of which is absorbed by greenhouse gases in the atmosphere or re-radiated back towards the earths surface.
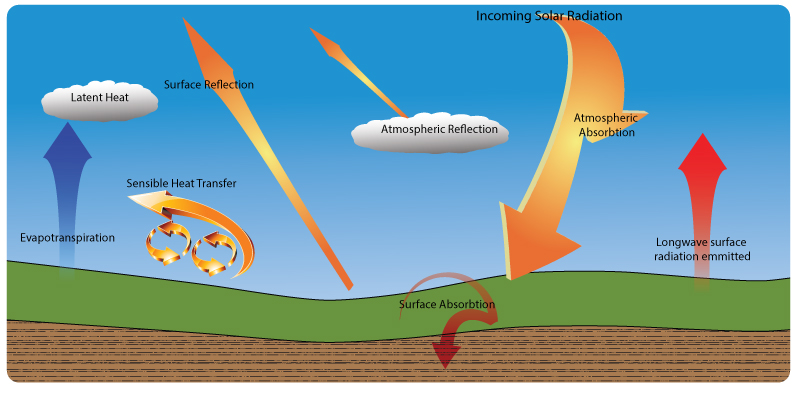 Img 2.1: Atmospheric energy balance
The greenhouse effect
The natural greenhouse effect
The greenhouse effect is the process described above - in which gases in the atmosphere trap long-wave radiation emitted by the earths surface and contribute to a warming of the atmosphere.
This is a natural process that is vital for life on earth to exist, since without it the climate would be too cold. The main greenhouse gases are:
- Water vapour: the most abundant of the greenhouse gases
- Carbon dioxide: released mostly through burning of fossil fuels and forests but also volcanic erruptions.
- Methane: released by animals and decaying vegetation, more effective than carbon dioxide.
- CFCs: man-made chemeicals which are vastly more effective at trapping long-wave radiation than both CO2 and methane.
The enhanced greenhouse effect
This refers to the principle that human activity is adding significant additional quantities of the greenhouse gases to the atmosphere and enhancing (accelerating) the natural process. This is disrupting the natural balance and leading to a relatively rapid warming of the atmosphere.
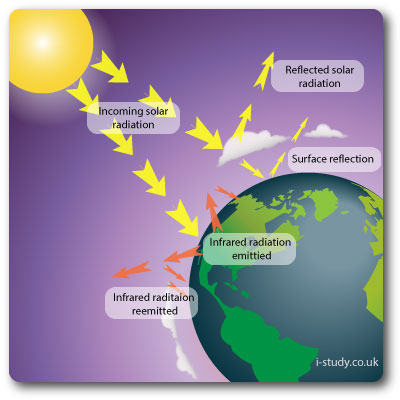 Img 2.2: The greenhouse effect
Feedback loops
Positive feedback loops
Feedback that amplifies or increases change; it leads to exponential deviation away from an equilibrium. Positive feedback creates instability in systems.
- In the diagram an increase in gobal temperatures leads to melting of sea ice.
- The loss of white reflective surfaces reduces the albedo rate which results in the exposed darker surfaces of the oceans absorbing more solar energy which raises global temperatures and peretuates the process.
- This system will get further and further from the inital point of equilibrium.
Task
- Draw a feedback chart to show the impact of the increasing methane being released from decaying vegetation in thawing permafrost
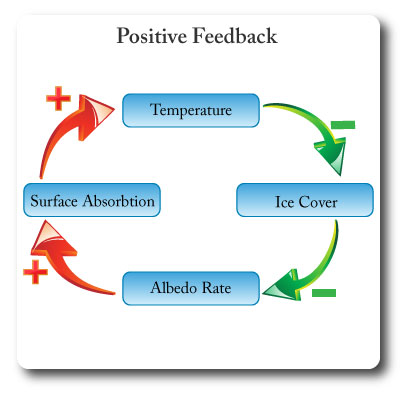 Img 2.3: Positive feedback loop
Negative feedback loops
Feedback that tends to damp down, neutralize or counteract any deviation from an equilibrium, and promotes stability.
Negative feedback creates more stability in systems.
- In the diagram an increase in carbon dioxide leads to increased atmopsheric temperatures.
- This in turn leads to higher rates of photosythesis which results in more carbon dioxide being removed from the atmosphere and therefore counteracting the rise in temperature.
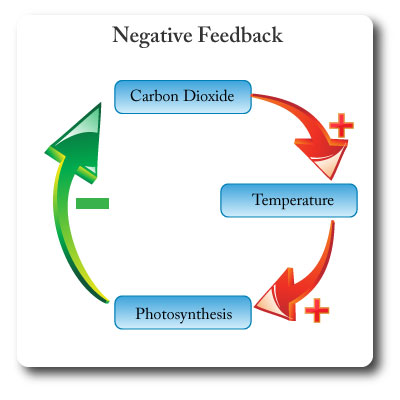 Img 2.4: Negative feedback loop
Global dimming
Global dimming refers to the theory that increased levels of atmospheric pollution have been having a cooling effect of the planets atmosphere.
The unprecedented grounding of all aircraft after the terrorist attacks on the World Trade Center in 2001 led to a rise in temperature. Scientists believe that the pollution particles in the air act as condensation nuclei around which water droplets form (clouds). Polluted air is leading to clouds having more small water droplets in them which reflect a higher proportion of insolation back out to space.
Pan-evaporation studies have shown decreasing levels of solar radiation reaching the earths surface in most places over that half century.
 Img 2.5: Pollution causing global dimming
Greenhouse Gas Emitters
Img 2.6: Greenhouse gas emitters
Who is releasing the most gases and why?
The major sources of greenhouse gas emissions are well known but reducing them appears to be a difficult process. The polluting countries are not neccessarily the ones that are suffering the worst effects of climate change. In addition, historically countries have created huge amounts of air pollution on the road to development yet NICs (newly industrialised countries) are being told not to do the same.
Tasks
- Study fig 2.6 - interactive infographic (use fig 2.7 if on mobile device):
- Take the top 10 emitters and suggest reasons for the high levels of pollution (dont just state the labels - think about why these countries need such high levels of energy generation etc).
- Explain the impact of industrialisation on greenhouse emissions.
- How has globalisation led to increased greenhouse gas emissions?
 Img 2.7: Greenhouse gas emitters, source
Total CO2 Vs Per Capita CO2
- Open this link: http://www.wri.org//blog/2014/05/history-carbon-dioxide-emissions
- Scroll down the the graph titled: 1960-2011: Per Capita Emissions in the West—Stable, but High
- Describe the pattern shown - (who are the main producers of carbon dioxide/capita and how have their emissions changed over time?)
- Now scroll to the graph titled: 1990s-2011: The Rise of Asia
- Describe the pattern shown - (who are the main producers and how has it changed over time)
- Describe the main differences between the two graphs.
- Explain the differences shown.
- In your opinion - which countries are most responsible for the high levels of carbon dioxide in the atmosphere.
- With reference to the first graph - what are the implications for carbon dioxide emissions of rising standards of living in Asian countries.
Img 2.5: Pollution causing global dimming


