IGCSE Economics Basic Econonomic Problem

Development

Economic development considers the welfare of a country’s citizens, whilst economic growth just looks at increasing GDP.

When considering welfare, it is clear that some countries are better off than others. Some countries’ people enjoy good health care, clean water and cheap luxury goods. Other countries experience high pollution, low life expectancies and a lack of job opportunities.

We therefore split countries into two distinct catagories: ‘Developed’ (which indicates high levels of welfare) and ‘Developing’ (which indicates low levels of welfare).

Placeholder image
Figure 1.1: Low investment in education

Causes of Differing Levels of Development

Many combinations of factors have led countries to differ significantly in their current levels of development and also how quickly they are developing

Environmental Factors

  • Climate: extremes in climate make agriculture and more difficult, leading to lower populations. Humidity, heat and extreme cold are also not ideal for most industrial processes.
  • Fertile soils: these were needed to support growing populations.
  • Natural resources: areas with resources such as tin, iron ore, fossil fuels have been able to export high value commodities. Natural resources are still a driving factor in the modern world (copper, bauxite, cobalt, crude oil etc)
  • Natural Disasters: areas prone to volcanoes, earthquakes and hurricanes have often been devastated in the past and had to rebuild their economies.

Political

  • Corruption: public money and power being used for personal gain by the rulers leads to lower investment in infrastructre, health and education
  • High military spending: countries at war use vast economic reserves on military equipement (often imported) rather than investment in the economy and society
  • Political instability: this creates uncertainty in the future of the country and puts foreign firms off investing.

Historical

  • Colonial debt legacy: unsustainable debts and aging infrastructure after independece has left many countries unable to get out of debt
  • Slave trade: many African countries lost the majority of their most able workers.
  • Unfair trade deals
Natural resources and development
Figure 1.2: Mining for gold in Tanzania
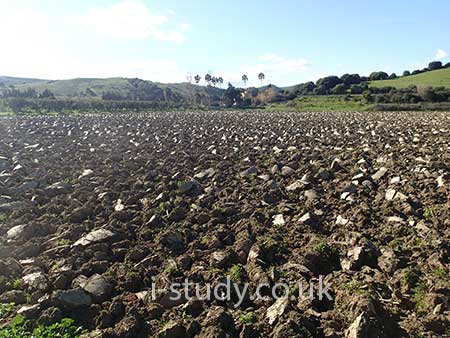
NFertile soil and development
Figure 1.3: Fertile agricultural land

Measuring Development

Economic indicators

  • GNI (Gross National Income)
  • GNI/capita

These are often used to measure development but they have some serious limitations. They give an average for the country and don´t highlight significant inequalities. They don´t give any clear indication about the actual welfare for residents (their standard of living).

Social indicators

  • Life expectancy
  • Crude birth and death rates
  • Literacy rates
  • Number of people per doctor

These are a few of the social indicators that are often used to give an indication of the standard of living in a country. Taken on their own they again give a limited indication of development in country.

The HDI (Human Development Index)

This is a composite index that aims to take into account both economic and social factors to give a single value. Its component factors are:

  • Life expectancy index: how long an individual is expected to live at birth
  • Education Index: mean years spent in school and mean years expected to be spent in school
  • Income Index: GNI per capita PPP.

It is generally regarded as giving a better indication of development but still has some limitations. Statistics are often hard to come by and many other important considerations are omitted (such as impact on the environment).

Relative and Absolute Poverty

Many developing countries are burdened with poverty. Poverty can be divided into two types:

Relative Poverty

To be in relative poverty, this would mean that we are poor compared to the average person in our country. For example, if you live in Denmark but cannot afford a fridge, you are relatively poor. This is more prevalent in developed countries.

Absolute poverty

This refers to the inability to provide for your own survival – usually this is when we earn less than $2 a day.

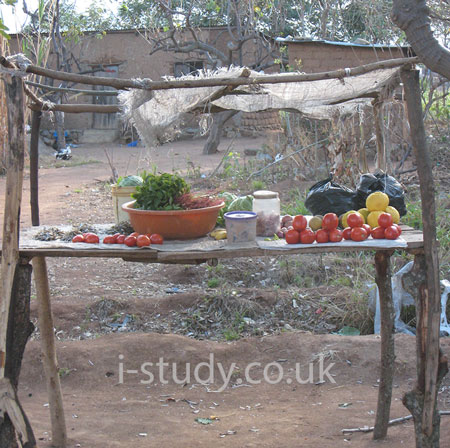
Absolute poverty
Figure 1.4: Absolute poverty in Tanzania

Population Growth

The world is experiencing a population explosion driven primarily by relatively high birth rates in developing countries coupled with falling death rates. The fastest growing populations are all in developing countries, while some MEDCs are facing population decline.

Population growth occurs because of two factors:

  • Natural Increase: when the birth rate is higher than the death rate.
  • Net Migration Gain: when the number of migrants into a country exceeds the number leaving a country.

The reverse of these would result in population decline (natural decrease and net migration loss).

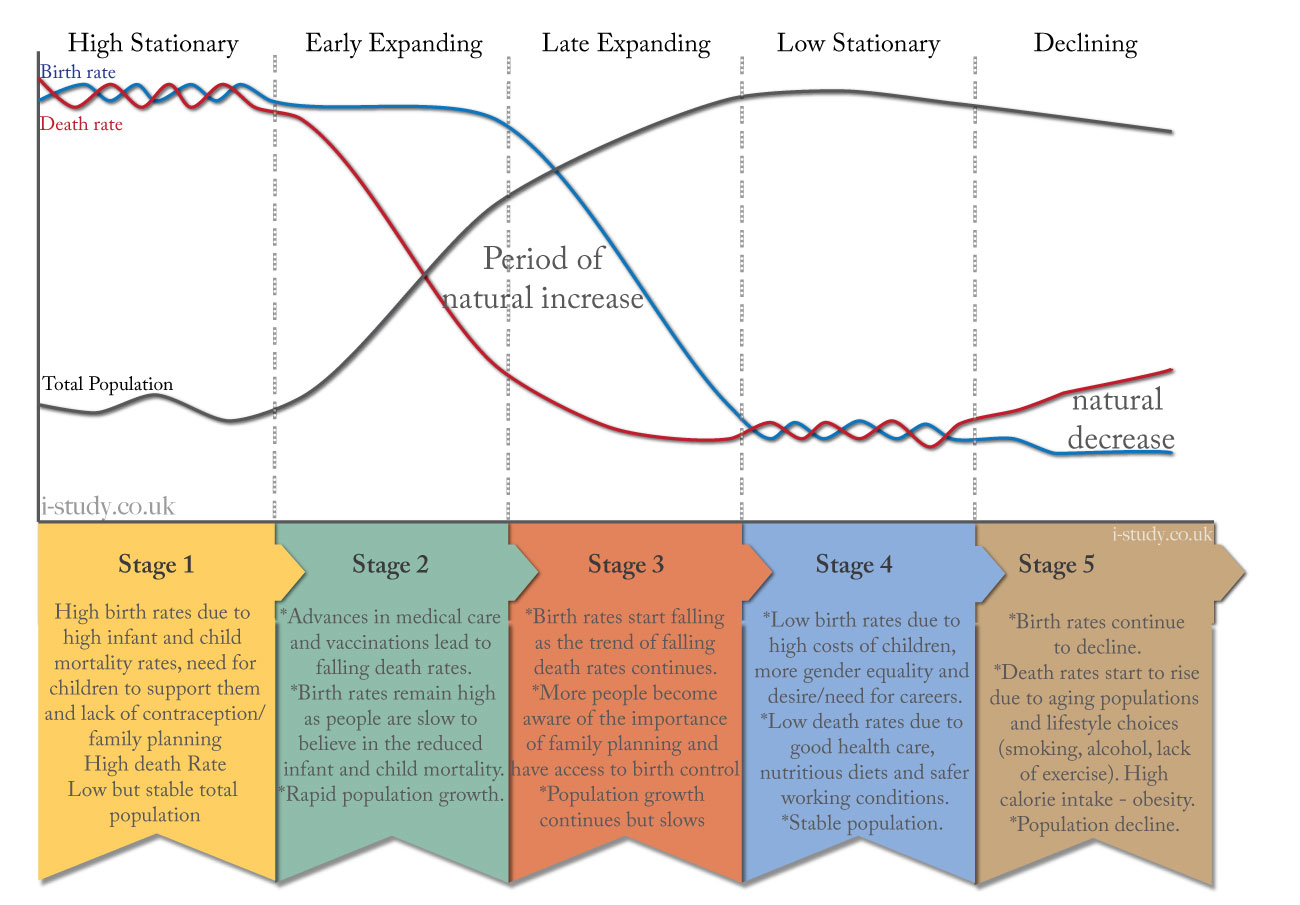
Study Figure 1.5 (below) which shows the typical population growth pattern that most countries follow (at different rates).

Video: Population Growth
Demographic Transition Model
Figure 1.5: Demographic Transition Model

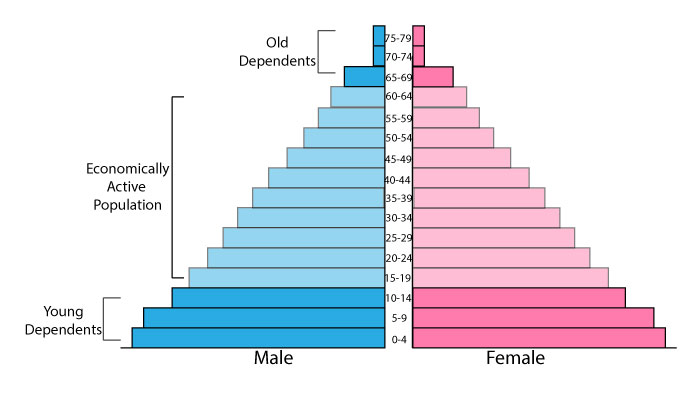
Developing Country Population Structure

These population pyramids typically have wide bases due to high birth rates.

A classic pyramid shape with sloping sides due to a high death rate at all ages.

They are short due to relatively low life expectancy.

These countries have a decline in the population age groups that are economically active. The working poulation have to suppport a large young dependent population through taxes and domestically.

Population pyramid for less developed countries
Figure 1.6: Developing Country Structure

Developed Country Population Structure

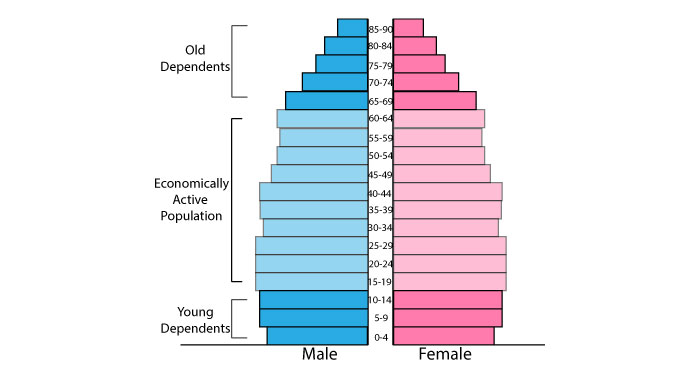
These population pyramids tend to be narrow at the base (low birth rate) and remain a similar shape up to the ages of 65+ due to a low death rate through these ages.

The pyramid is often tall due to long life expectancy.

They have a large proportion of the population in the economicaly active age groups - these are part of the labour force and pay taxes. They support the dependent populations. Many developed countries are now facing increasing proportions of elderly people that the tax payers need to support.

Population pyramid for more developed countries
Figure 1.7: Developed Country Structure
Video 1.1: Youthful Populations
Video: Russian Pro-natatist Approach

Globalisation

Economics Revision e-Guides and e-Textbooks