IGCSE Economics allocation of resources

Planned Economies

  • The government makes the decisions about what is produced how its produced & who produces it.
  • The government is the main owner of land, labour and capital.
  • The government is the employer, sets wages and decides prices.
  • The government issues its instructions through directives.
  • There are few planned economies in the world.
  • Goods produced may not match the consumers wants.

Example: North Korea

Market Economies

  • Also known as free enterprise economies
  • Minimum government involvement/intervention.
  • Land & capital are privately owned.
  • Consumers decide what is produced by paying more for the things they want.
  • Firms and resources switch to things that are more popular.

Advantages: efficient use of resources, more choice & potential to make lots of money.

Disadvantages: profit maximisation aims mean that public goods are not likely to be supplied & external costs not accounted for.

No pure market economies exist in the world.

Mixed Economies

  • Combination of both the above systems.
  • Public and private firms, land and capital.
  • Market forces provide choice and efficiency in some industries.
  • Government can provide public goods such as defence & street lighting.
  • Government can encourage consumption of merit goods and discourage consumption of demerit goods.
  • Government can impose charges on private firms to reflect external costs such as pollution.
  • All economies are mixed but to different degrees.

Example: United Kingdom

In any country, we can catagorize production into three or four main industries:

  • PRIMARY SECTOR- these are the firms that draw or extract natural resources from the earth. This may be as varied as coal mining or fishing, corn growing or oil drilling.
  • SECONDARY SECTOR - these are the firms involved in turning natural resources into finished products. This may vary from car production to packaging. They manufacture the goods.
  • TERTIARY SECTOR- firms in this sector provide the retail outlet for the finished products or provide a service for the customer. This may range from shops on the high street to teaching. It can differ between high and low value jobs. Cleaners, waiters, retail workers tend to have low incomes. Bankers, software developers, accountants earn high incomes.
  • QUATENARY SECTOR- firms in this sector are usually involved in intangible services such as research and development.
primary, secondary and tertiary sectors
Figure : Industrial Classifications

Demand Curves

Demand Curves

  • Individual demand is how much of a casino games product a consumer will buy at a given price.
  • Market demand is the sum of all the indivudual demand for a product at a given price.
  • Demand is based on the actual ability of consumers to purchase the product, not just what they would like but cant afford (sports car, jewellery etc). This is called effective demand.
  • Demand curves slope down from left to right - this is because the higher the price the more of a consumers income must be spent on it & the more satisfaction they must get from it to justify the opportunity cost. Being successful is always the sweetest a part of gambling, obviously people desire winning each time they wager. Roulette just like any other video game makes persons invent diverse systems and schemes to reduce losses and maximize pleasure.
demand curve
Figure: Demand Curve Characteristics

Movement along the Demand Curve (Price)

A change in price causes a reverse labouchere system movement along the curve

  • The higher the price of a product, there will be less demand for it.
  • If the price rises then demand will fall, this is known as an contraction in demand.
  • The lower the pice of a product the more it will be demanded roulette strategy.
  • If the price falls then demand will rise, this is known as an extension in demand.
demand curve
Figure: Movements along the demand curve

Shift of the Demand Curve

A shift of the demand curve represents an increase or decrease of demand at a given price level. This may be because of:

  • a change in consumers incomes
  • a change in price of competing products
  • changes in tastes/fashion
  • seasonal factors such as weather
demand curve
Figure: Shifts of the demand curve

Supply Curves

Movement along the Supply Curve (Price)

A change in price causes a movement along the curve

  • The higher the price of a product, the more suppliers will produce.
  • If the price rises then supply will rise, this is known as an extension in supply.
  • The lower the pice of a product the less will be supplied.
  • If the price falls then supply will fall, this is known as an contraction in supply.
supply curve contractions & expansions
Figure : Movements along the supply curve

Shift of the Supply Curve

A shift of the supply curve represents an increase or decrease in the quantitiy supplied at each & every price. Causes of shifts in supply:

  • Improvements in technology (increase efficiency & reduce costs).
  • Weather, climate and disease (especially agricultural products).
  • Taxes and subsidies can make the costs of production more/less expensive and therefor increase or decrease supply.
  • Natural disasters & wars can severly disrupt supply.
  • Resources: discoveries of new resources or depleting reserves of resources can affect the supply of products.
supply curve shifts
Figure : Shifts of the supply curve

Equilibrium & Excesses

Equilibrium

The equilibrium price is the point at which demand and supply are equal (where they cross on the diagram). It is also called the market clearing price since it is the point at which all the items supplied are demanded - therefor clearing the market of all the stock.

Consumers want low prices & suppliers want higher prices, this leads to adjustments in the price of products until the equilibrium point is reached.

equilibrium
Figure: Market Clearing Point

Excess Supply

This situation occurs when the price level is too high which results in a larger quantity supplied than quantity demanded.

Suppliers want to sell the extra stock that they have before it goes bad or out of season so they will lower the price. This leads to an expansion in the quantity demanded and a contraction in the quantity supplied bringing the market back into equilibrium.

excess supply
Figure: Excess Supply

Excess Demand

This occurs when the price is set too low which result in a larger quantity being demanded than there is available from the suppliers.

Suppliers realise that they can charge a higher price and still sell more products so the price level rises which leads to a contraction in demand (some people wont buy at the higher price) and an extension in supply, bringing the market back into equilibirum.

excess demand
Figure: Excess demand

Price Elasticity of Demand measures the responsiveness between a change in price and the effect on quantity demanded. Measured using formula:

PEoD = (% Change in Quantity Demanded)/(% Change in Price)

Price Inelastic; tells us that a great change in price results in a small change in quantity demanded. Has a PED of less than 1. Usually goods with low starting price or necessities.

Price Elastic; tells us that a small change in price results in a large change in quantity demanded. Has a PED of more than 1. Usually luxuries or goods with many substitutes

price inelastic
Figure : Price inelastic
unitary price elastic
Figure ; Unitary elasticity
price elastic
Figure : Price elastic

Merits of the Market System

Market Clearing Mechanism

The forces of supply and demand utilize fluctuations in price to achieve equilibrium and clear the market.

Diagram 1

An exceptionally long drought in Spain destroys a significant proportion of the olive harvest. The immediate effect is likely to be excess demand (B-A). This is then corrected as the decrease in supply leads to higher prices (P1) and subsequently a contraction in demand until demand and supply are in equilibrium again.

Diagram 2

The following year the climate leads to a much better harvest of olives. This leads to a situation of excess supply (A-B). To correct this, the price decreases to the point at which the extension in demand brings the market back into equilibrium.

Placeholder image
Figure: Market clearance example
Placeholder image
Figure: Market clearance example

Competition

The presence of competition between suppliers in market systems enables consumers to have choice. Firms use price as one form of competition, this leads to lower prices for consumers and greater efficiency for firms as they attempt to minimize costs and maximize profits.

Competition also encourages better allocation of resources as firms that quickly recognize changes in demand and switch their production into growing markets can benefit from increased profit.

Firms that fail to recognize changes in consumers demand and allocate resources ineffectively are likely to experience declining profits and eventually may go out of business.

Placeholder image
Figure: Market clearance example

Failures of the Market System

Social Costs

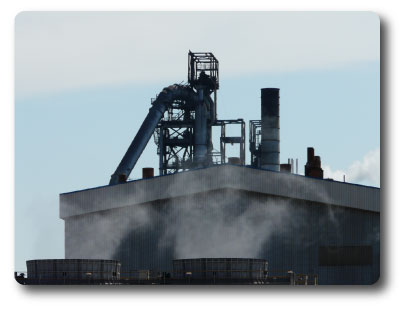
When considering the cost of production or offering a service we need to take into account more than just the cost to the company. There are wider costs that affect society such as air polltion that are not accounted for on the price.

Private costs: these are the costs to individuals of consuming a product, often the monetary value, but sometimes a health cost such as smoking. They are also the costs to a firm (fixed and variable costs) of production.

Private benefits: the benefit to an individual from consuming a product, often satisfaction, more knowledge etc. In the case of a firm these are likely to be the profits that are made.

External costs: the costs of production or consumption of an item to a third party - litter, air pollution, water pollution are examples, these are often called externalities.

External benefits: the benefits of production or consumption to a third party - other firms & society may benefit from the skills that workers learn through their jobs such as first aid, it skills etc.

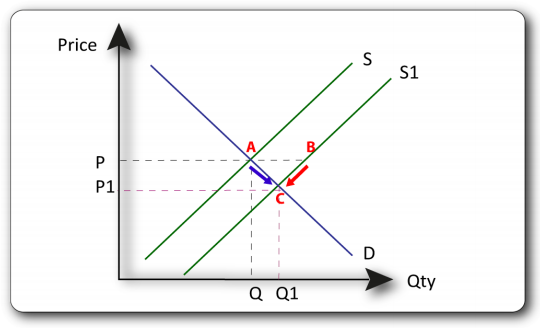
To establish the total cost or benefit to society the total value of the private costs and eternal costs needs to be calculated. The sum of the private and external benefits need to be calculated. If the social cost is greater than the social benefit then the resources & factors of production should be used ot produce something else that is more socially beneficial.

Placeholder image
Figure: External cost from manufacturing

Economics Revision e-Guides and e-Textbooks