

The basic economic problem is that people have unlimited wants but there are are limited resources to satisfy these wants.
The land for farming and building on, but it also includes the resources under the land (coal, minerals, metals etc), the resources on the land (forests, lakes etc) and the fish stocks in the sea.
The supply of land does not really change but the resources in/on the land can change significantly due to mining, forestry, fishing etc.
Labour is the human effort that is used to produce an item, both mentally & physically.
The supply of labour is determined by how many workers are available & how long they can work for. Factors affecting this include:
Capital is anything that is used to produce other goods & services rather than being used for its own sake (machinery, tools, offices etc).
There are 2 main categories of capital:
The supply of capital generally increases as machinery is replaced/updated or factories expand their premises.
This is the decision making and risk bearing in business by an entrepreneur. An entrepreneur has to organise the factors of production and decide what & how much to produce.
Some risks can be insured against (fire, theft etc), but others such as increases in costs of production & increased competition cannot
This is the cost of the best alternative that is given up when a decision is made. This can be applied to products that we buy, the jobs that we undertake and the products firms decide to make. Private firms generally base their decisions according to which product will maximise their profit.
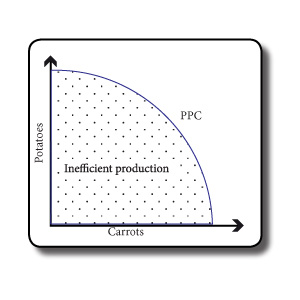
This indicates the points at which factors of production are being used most efficiently. It is sometimes also known as the Production Possibility Frontier (PPF).
Any point to the left of the curve means that resources are not being used to their potential (uemployed labour, land not being used etc).
The curve can be moved outwards to the left through the discovery of new resources, new technologies that increase efficiency or increases in the quality of the factors of production.
It is also known as the Opportunity Cost Curve as it shows the opportuntiy cost of producing more of one product.
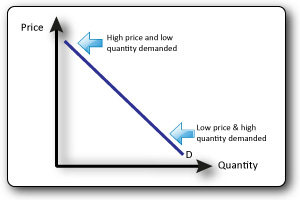
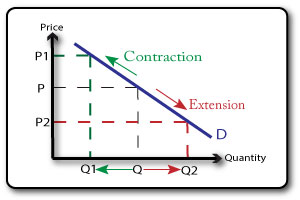
A change in price causes a movement along the curve
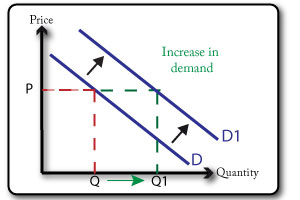
A shift of the demand curve represents an increase or decrease of demand at a given price level. This may be because of:
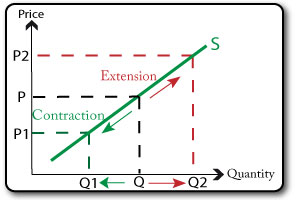
A change in price causes a movement along the curve The higher the price of a product, the more suppliers will produce.. If the price rises then supply will rise, this is known as an extension in supply. The lower the pice of a product the less will be supplied. If the price falls then supply will fall, this is known as an contraction in supply.
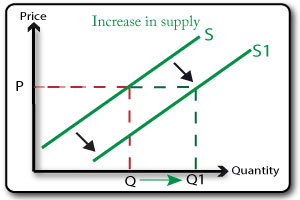
A shift of the supply curve represents an increase or decrease in the quantitiy supplied at each & every price. Causes of shifts in supply:
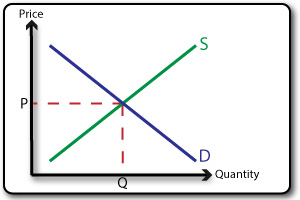
The equilibrium price is the point at which demand and supply are equal (where they cross on the diagram). It is also called the market clearing price since it is the point at which all the items supplied are demanded - therefor clearing the market of all the stock.
Consumers want low prices & suppliers want higher prices, this leads to adjustments in the price of products until the equilibrium point is reached.
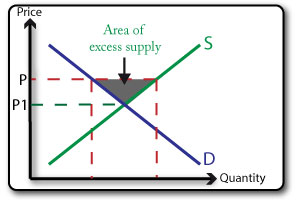
This situation occurs when the price level is too high which results in a larger quantity supplied than quantity demanded.
Suppliers want to sell the extra stock that they have before it goes bad or out of season so they will lower the price. This leads to an expansion in the quantity demanded and a contraction in the quantity supplied bringing the market back into equilibrium.
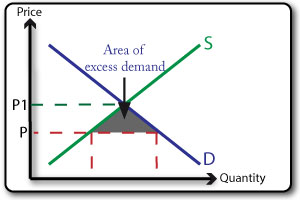
This occurs when the price is set too low which result in a larger quantity being demanded than there is available from the suppliers.
Suppliers realise that they can charge a higher price and still sell more products so the price level rises which leads to a contraction in demand (some people wont buy at the higher price) and an extension in supply, bringing the market back into equilibirum.
When considering the cost of production or offering a service we need to take into account more than just the cost to the company. There are wider costs that affect society such as air polltion that are not accounted for on the price.
Private costs: these are the costs to individuals of consuming a product, often the monetary value, but sometimes a health cost such as smoking. They are also the costs to a firm (fixed and variable costs) of production.
Private benefits: the benefit to an individual from consuming a product, often satisfaction, more knowledge etc. In the case of a firm these are likely to be the profits that are made.
External costs: the costs of production or consumption of an item to a third party - litter, air pollution, water pollution are exmaples, these are often called externalities.
External benefits: the benefits of production or consumption to a third party - other firms & society may benefit from the skills that workers learn through their jobs such as first aid, it skills etc.
To establish the total cost or benefit to society the total value of the private costs and eternal costs needs to be calculated. The sum of the private and external benefits need to be calculated. If the social cost is greater than the social benefit then the resources & factors of production should be used ot produce something else that is more socially beneficial.
Money has allowed us to develop systems of trade that do not rely on barter. In an economy based on barter some products and commodities may perish & lose value, be difficult to transfer to another owner or to divide into small amounts.
The government’s bank:
There is a wide range in the amount that individuals get paid for the work they do. Various reasons exist:
Specialisation of labour focuses workers on a single task or small range of tasks. Firms hope that specialisation will lead to lower costs:
Individuals spend to buy the goods and services that they want or require. There are several factors that affect peoples spending choices:
People save money in various ways and for different reasons:
Reasons for saving
Factors affecting saving
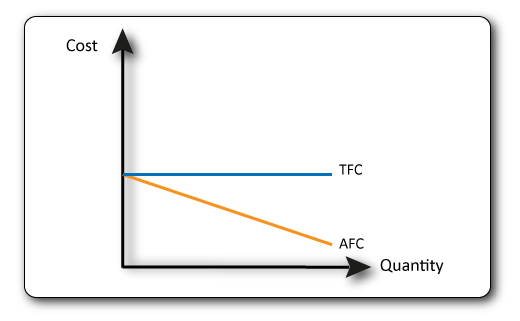
These are the costs that don’t vary with output such as rent, interest on loans etc. This means that the Total Fixed Cost (TFC) line is straight.
The Average Fixed Cost (AFC) line is sloped. TFC/output = AFC.
If fixed costs are $10 and 1 item is produced then the AFC is $10, however if 2 items are produced then the AFC is $5.
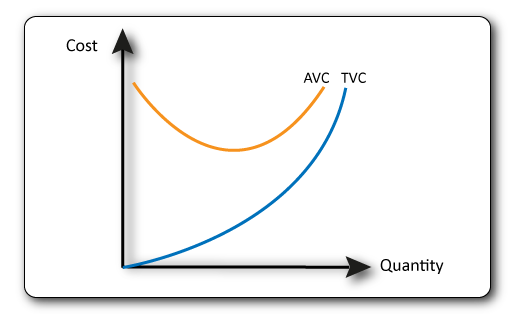
These are the costs that change as output changes such as raw materials, wages, utility bills. As output increases Total Variable Costs (TVC) increase.
Average Variable Costs (AVC) initially fall as productivity of workers increase and the firm benefits from economies of scale but these diminish & may reverse with increased output. TVC/output = AVC.
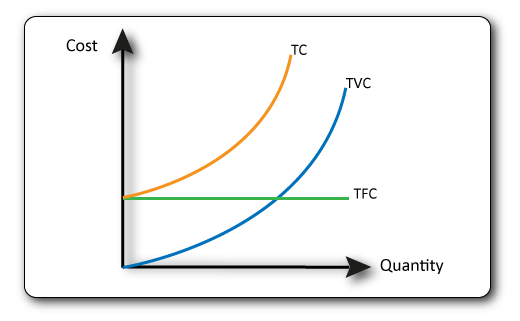
Fixed Costs + Variable Costs = Total Costs.
The total cost line starts at the level of the fixed cost line since these costs must be paid despite no production. Average Costs = total cost/output
This is the total amount of money a firms recieves from selling goods (before costs are deducted).
Average Revenue = Total revenue/output
Indicators of a firms size:
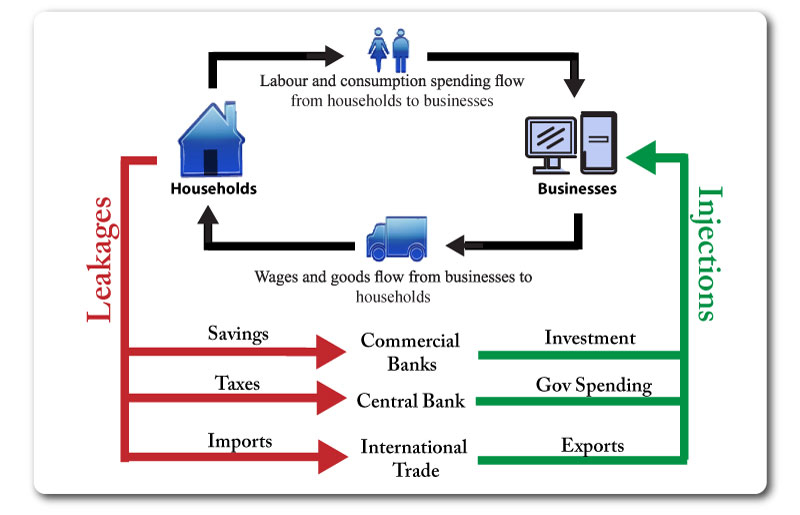
This is the total demand in the economy.
It is made up of:
This is the total supply in the economy.
Less Developed Country (LDC)
LDC Characteristics
Environmental: Climate, Fertile soils, Natural disasters, Natural resources
Political: Corruption, High military spending
Historical: Colonial debt legacy, Unfair trade deals, Slave trade
LDC Population Structures
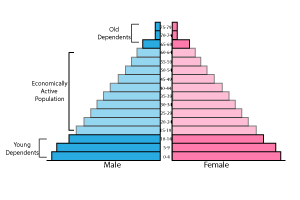
LDC pyramids typically have wide bases due to high birth rates. A classic pyramid shape due to a high death rate at all ages. They are short due to relatively low life expectancy.
Youthful Populations
Many LDCs have large proportions of their population who are young. This creates problems:
MDC Population Structures
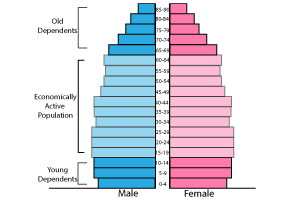
MDC pyramids tend to be narrow at the base (low birth rate) and remain a similar shape up to the ages of 65+ due to a low death rate through these ages. The pyramid is often tall due to long life expectancy.
Aging Populations
Many MDCs have large proportions of their population who are elderly. This creates problems:
Balance of Payments = current account + capital account + financial account + official reserves
This shows the income and spending from trade with other countries. The main parts are:
Why Specialize?
If countries focus on producing what they are best at & then trade with other countries for the products they need, it should result in all the countries having more goods & services to share in total.
This is the ability of a country to produce more of a certain good than other countries can with the same amount of resources.
Therefore countries should specialise in what they have an absolute advantage in & then trade.
Why use Protectionist Measures?
Methods of Protectionism
Benefits and Problems of Protectionist Measures
The total value of the goods and services produced in an economy.
This is the standard measurement but there are several variations that are used to provide a clearer picture of what is happening in the economy.
The Retail price Index (RPI)
Cost-Push Inflation
Demand-Pull Inflation
Monetary
Increases in the money supply that are greater than increases in output (more money chasing same output). It can be classed as demand-pull inflation.
Measured as the % of the labour force who are willing & able to work and looking for a job.
Methods for measuring unemployment vary & generally the official rate is lower than the actual number of people looking for work.
This is an index that takes into account 3 factors (each is an index itself):
It generates a score between 0 and 1. The closer to 1 the higher the quality of life.
It is considered a better measure of overall development then GNI or GDP because it takes into account social factors aswell as purely economic ones.