Broad Categories of Development
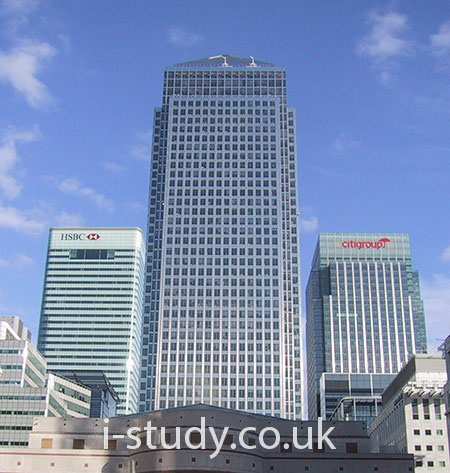
MEDC: More Economically Developed Country (Japan, UK, USA).
- These typically have high income per capita.
- Their economies are dominated by tertiary sector industries.
- Secondary industry are often light manufacturing or more high-tech production.
- Primary industries are highly mechanised, employ very few people but produce large quantities.
- The government ususally provides a lot of support in education, healthcare and pensions.
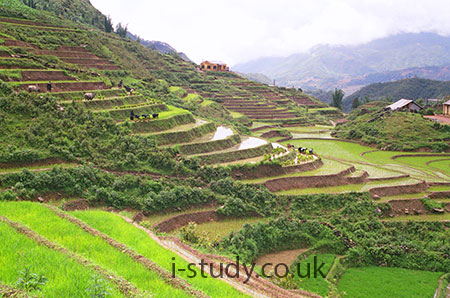
LEDC: Less Economically Developed Country (Tanzania, Solomon Islands).
- These typically have low income per capita.
- Their economies are dominated by primary industries, often low skilled and with low capital input.
- Labour and land are the main capital inputs.
- Susbsistence production is common and accurate calculations of GDP per capita is difficult due to barter and cash based local economies that dont always declare income.
- Families provide a lot of support for education, healthcare and looking after the elderly.
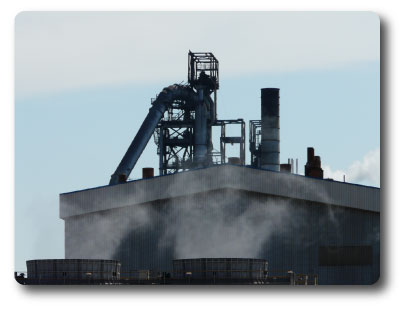
NIC: Newly Industrialised country (India, Brazil, China).
- These have rising income per capita.
- Their economies have transitioned into secondary industries, often dominated by heavy manufacturing and lower skilled production such as plastics and textiles.
- Increasingly they are moving into the more electronics manufacturing as the workforces become more skilled.
Economic Indicators
- GNI (Gross National Income): The total value of goods and services produced within a country together with the balance of income and payments from or to other countries.
- GNI/capita: this measures the average GNI per person in a country. It enables comparisons between countries of different population sizes.
These are often used to measure development but they have some serious limitations. They give an average for the country and don´t highlight significant inequalities. They don´t give any clear indication about the actual welfare for residents (their standard of living).
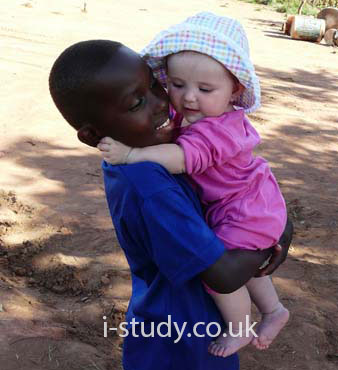
Social Indicators
- Life expectancy:
- Crude birth rate: number of birth/1000 of the population
- Crude and death rate: number of deaths/1000 of the population
- Literacy rates: % of adult that can read and write
- Infant mortality rate: number of babies that die before the age of 1 per 1000 live births
- Child mortality rate: number of children that die before the age of 5 per 1000 live births
These are a few of the social indicators that are often used to give an indication of the standard of living in a country. Taken on their own they again give a limited indication of development in country.
Human Development Index
This is a composite index that aims to take into account both economic and social factors to give a single value. Its component factors are:
- Life expectancy index: how long an individual is expected to live at birth
- Education Index: mean years spent in school and mean years expected to be spent in school
- Income Index: GNI per capita PPP.
It is generally regarded as giving a better indication of development but still has some limitations. Statistics are often hard to come by and many other important considerations are omitted (such as impact on the environment).
Tasks
- Describe the pattern shown on the UN HDI map here
Gap Minder Activity
Tasks
- Go to gapminder
- In the data search box enter infant mortality & click the visualise button, use the slider to see the relationship between IM & GDP/capita. Describe the trend over time.
- Take a screenshot of the graph in 2012. What type of correlation is shown?
- Which 2 countries seem to be lagging behind? Why?
- Do the same for food supply (calories/person), describe the trend over time, get the graph, identify the correlation with GDP/capita.
- Finally do the same for literacy rate (adult total).
- Go to the Happy Planet Index homepage.
- what is the happy planet index? What is it measuring?
- Why is this a useful index to consider in addition to the HDI?
- What limitations does it have?
- Which countries score well in the happy planet index and why?
Objective: Explain disparities and inequities that occur within countries resulting from ethnicity, residence, parental education, income, employment (formal and informal) and land ownership.
Tasks
- Go to this webpage: Geopods
- Work as a group to complete the case study. Use a shared google doc (rather than the titanpad suggested).
- Watch the long youtube video at home.
Millenium Development Goals
Objective: Examine the progress made in meeting the Millennium Development Goals (MDGs) in poverty reduction, education and health.
Tasks
- Go to the UN MDG homepage. Get a screen grab of the the MDGs logos (like fig 1.2).
- Download the latest report on the MDG progress.
- Write a summary/introduction about the what the MDGs are (when & what they set out to achieve etc).
- Click on the icons for goals 1,2,4 and 5. Copy the target/goal objectives for each one into your notes.
- Screen grab the information about goals 1,2,4 and 5.
- Using page 8, summarise them main areas that have had limited success.
- Suggest reasons why the MDGs have not completely reached their goals.

Debt Relief and HIPCs
Tasks
- Describe the HIPC initiative
- Read this HIPC impacts pdf
- Explain why debt relief for the most heavily indebted countries can play a major role in reducing the development gap.
World Trade Blocs
Tasks
Read pages 44 & 45, complete Qs a,b,c.

Remittances
- These are flows of money sent back by migrants to their home country.
- Remittances go directly to the intended recipient and can be used how they choose to improve their quality of life (rather than through governments or agencies).
- High fees unfairly penalise the poorest workers. Migrants sending small sums of money home get charged the highest %s. Also sending money to the poorest regions (African countries) also often carry higher fees.
- Watch video 1.1 for a good explanation of the importance of remimttances and the restictions on them.
Internation Aid
Aid agencies play an important role in reducing disparities in development. Many aid organisations are NGOs.
Tasks
- Define NGO
- Choose 2 NGOs and describe their role in development (who are they, how are they funded, what are there aims, give a couple of examples of projects that they are involved in.
- Do you think NGOs have advantages over Government aid policies. Explain your answer.
Content for Accordion Panel 5